Team

Curran Kelleher
Founding Member & Principal
Curran Kelleher is a data visualization expert and educator. He's worked at Stamen and McKinsey, and is well known in the dataviz community for his teaching — his YouTube tutorials have helped thousands of people learn D3.
He created VizHub, a platform for creating and collaborating on D3 visualizations in the browser. Currently based in India, Curran is always working on something new at the intersection of visualization and education.
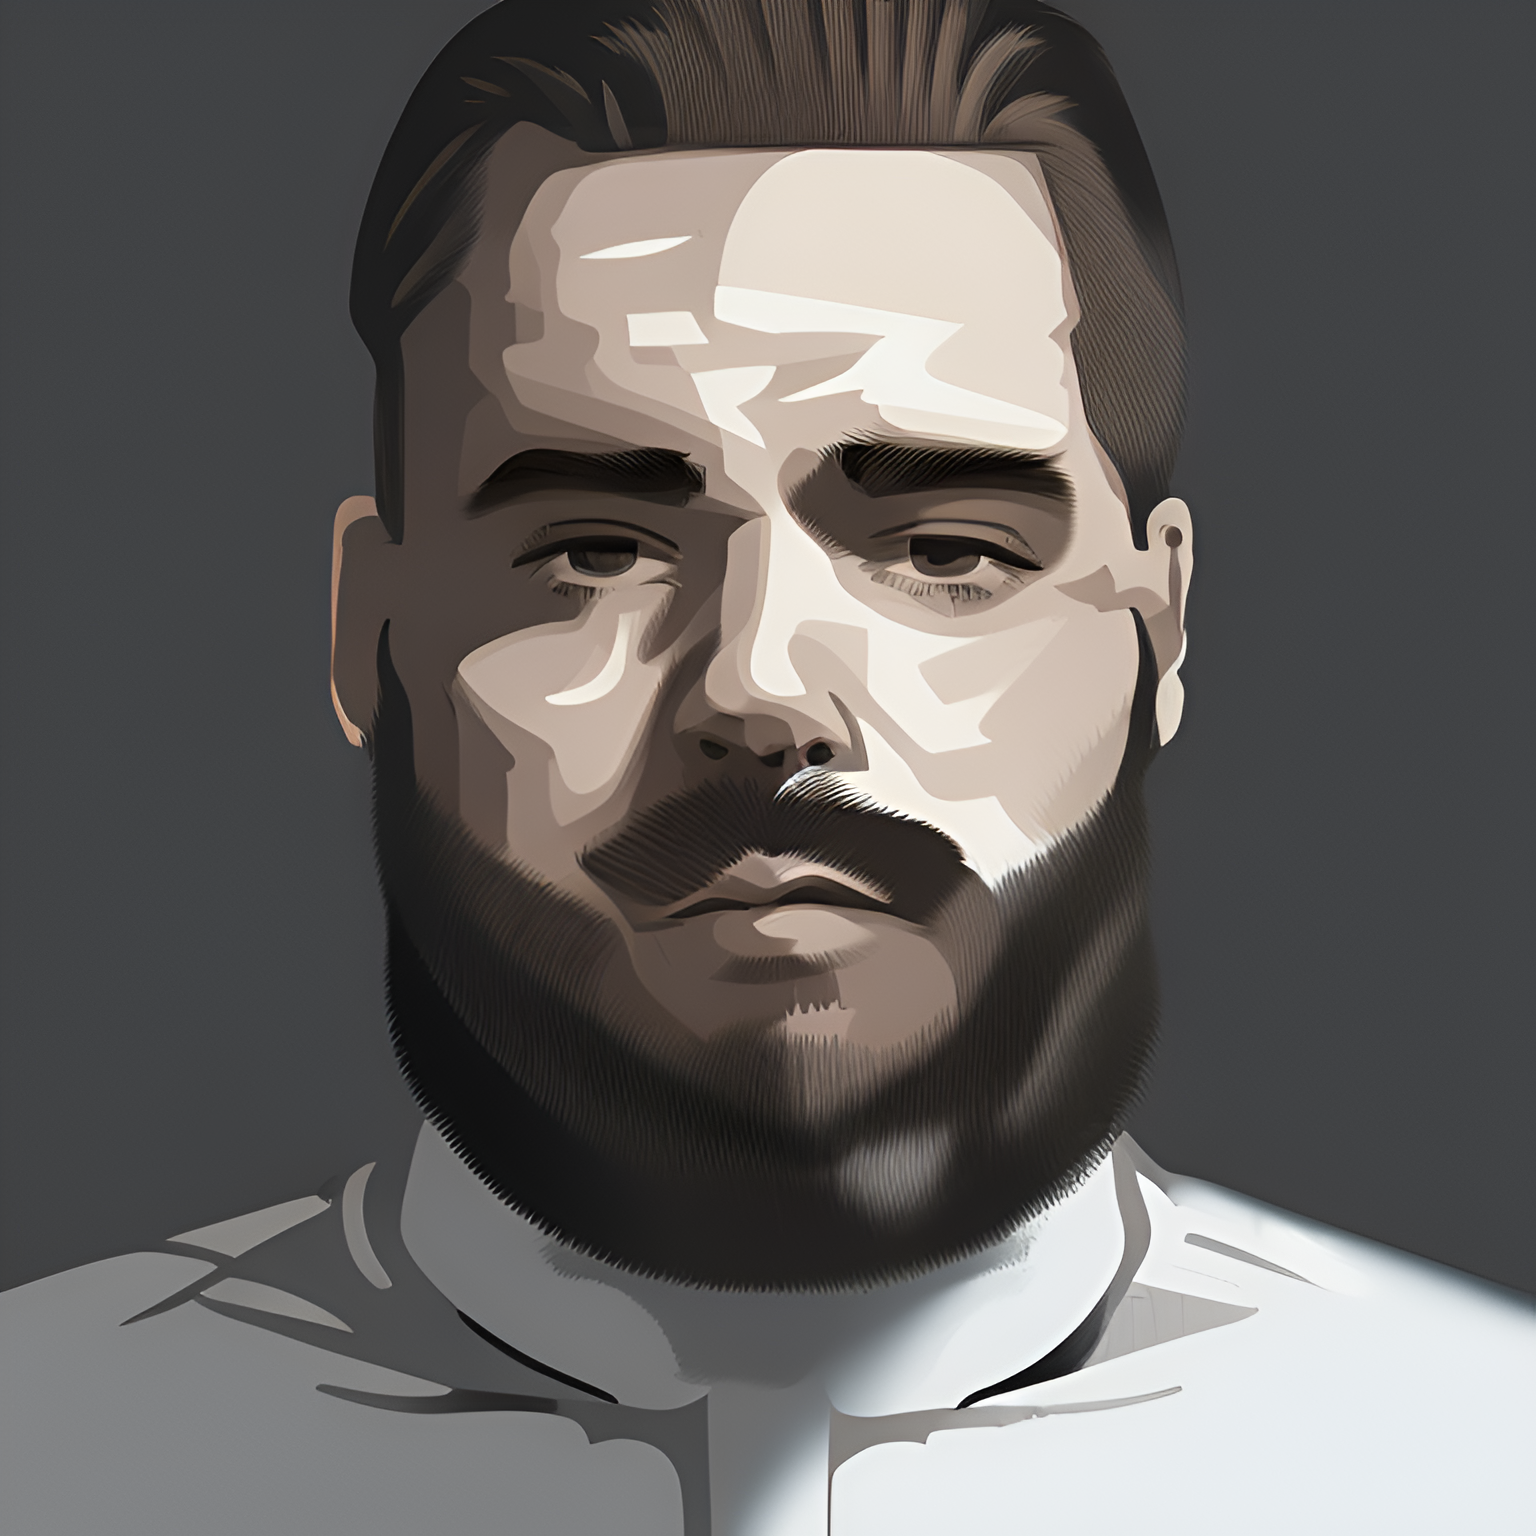
EJ Fox
Founder & Principal
EJ Fox is a data visualization designer and developer. He started with static infographics, learned to code, and at NBC News helped create the modern version of the Big Board — still used in election coverage today.
He founded Room 302 Studio to take on bigger projects with people he likes working with. He draws a lot of inspiration from nature, ecology, and art.


Ian Johnson
Founding Member
Ian Johnson is a data alchemist focused on building web-based data interfaces. Ian studied scientific computing in school and learned design on the job, bringing the two together to tackle sophisticated data projects.
Ian is passionate about creating and learning in the open by organizing workshops, meetups and developing open source tools like Blockbuilder, a tool that has enhanced the prototyping and learning experience for thousands of data visualization practitioners. Ian uses his bottomless supply of curiosity combined with a strong desire to share his learnings to enrich everyone who crosses his path.
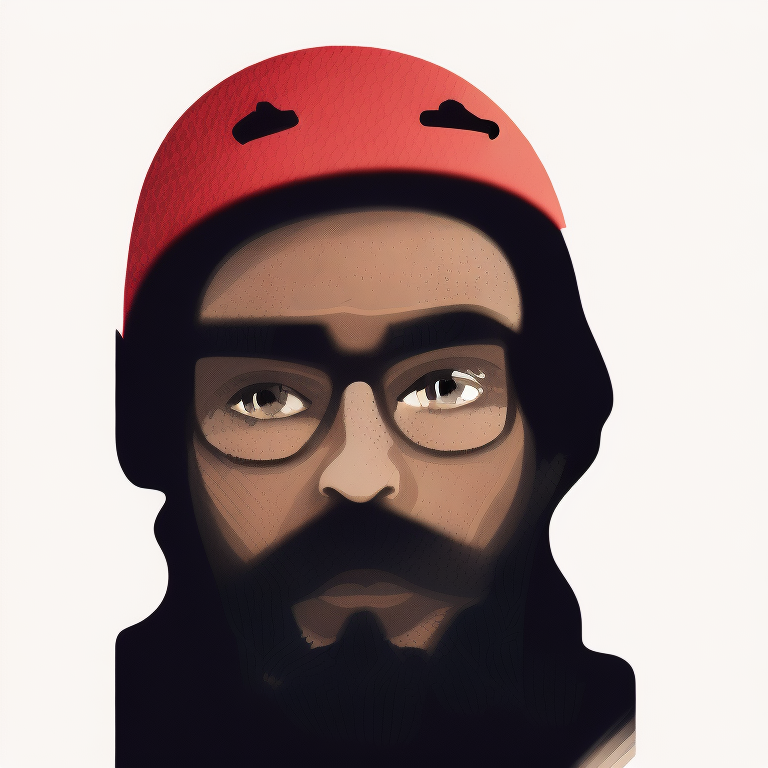
Israel Gonzalez
Staff Developer
Israel is a software engineer who got started building games in middle school and has been picking up new domains ever since — machine learning, data visualization, mobile apps.
At Room 302 Studio, he works on AI systems, simulations, and anything that involves getting language models to do useful things. He's interested in autonomous agents, robotics, and applying AI to scientific research.
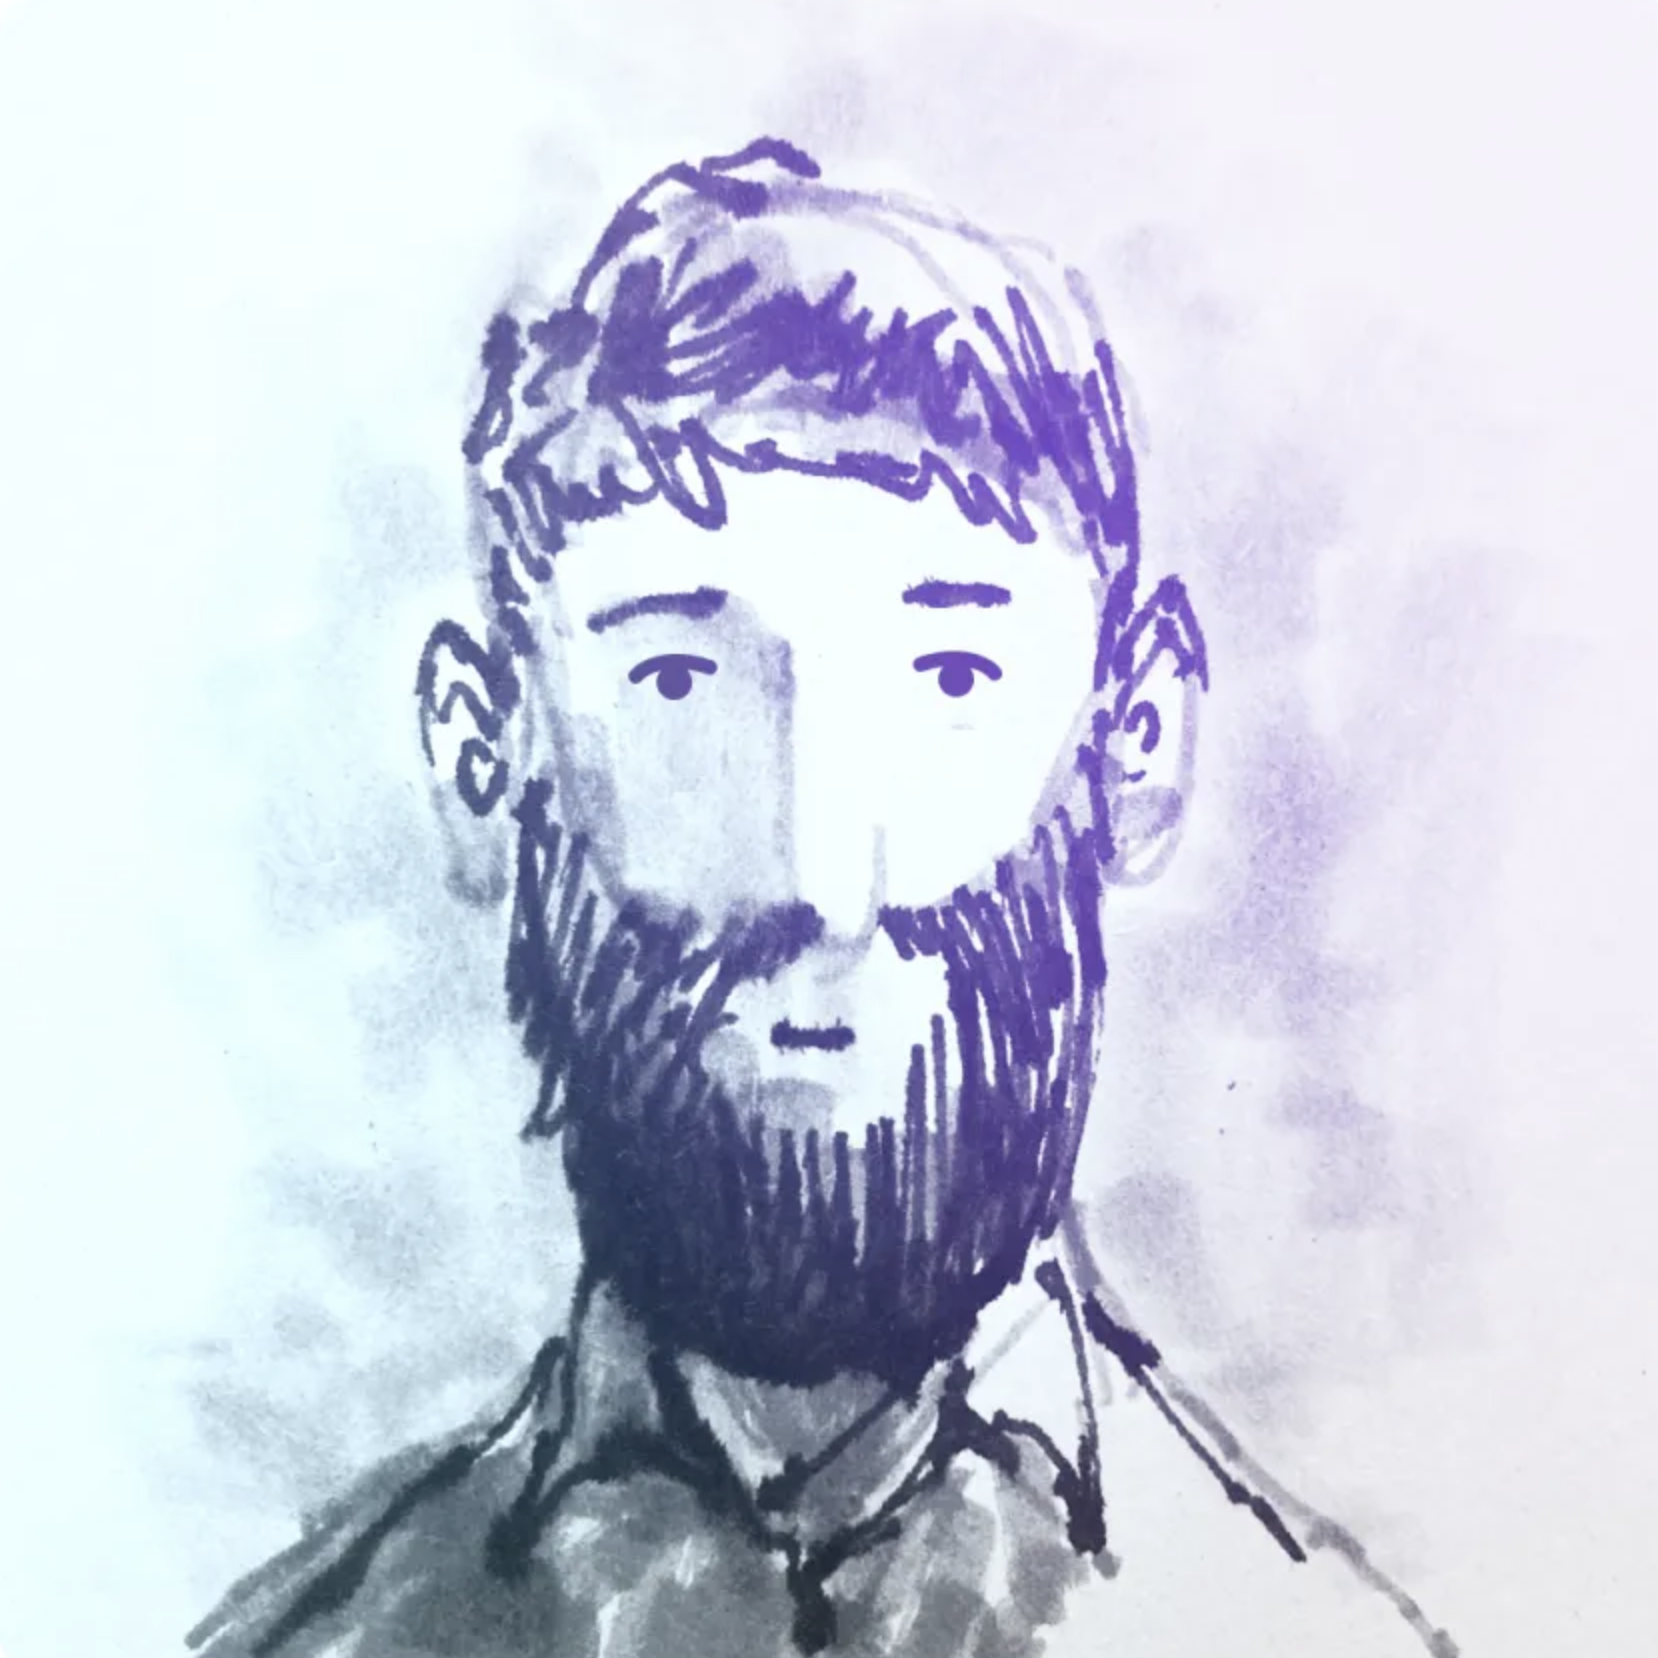
Sam Vogt
Staff Designer
Sam Vogt is an experienced visual designer with a focus on meaningful data narratives and visualization. Sam worked his way into visualization projects starting as an illustrator and brand designer, learning to encode organizational values in the elements of visual communication.
From there it was a surprisingly short jump to the world of data visualization because, after all, both disciplines share foundational principles such as integrity, accessibility, and emotional resonance - and both strive to turn information into action.