Mapping Environmental Justice
The Margin
Project Brief
In a series examining environmental justice's impact on different communities, we created interactive scroll-powered maps and visualizations for The Margin's five inaugural stories.
Client
The Margin
Services
Data Visualization & Interactive Storytelling
Technology
D3, QGIS, Mapbox
The Margin: Mapping Environmental Justice
In a series examining environmental justice's impact on different communities, we created interactive scroll-powered maps and visualizations for The Margin's five inaugural stories.
Editor Bryce Cracknell brought together a team of talented journalists, and we were tasked with creating maps, data visualizations, and timelines to provide an immersive and informative data-driven experience.
Our approach was to create visualizations that were not only informative but also deeply engaging. This included:
- Timelines: To chronologically illustrate the unfolding of environmental justice issues.
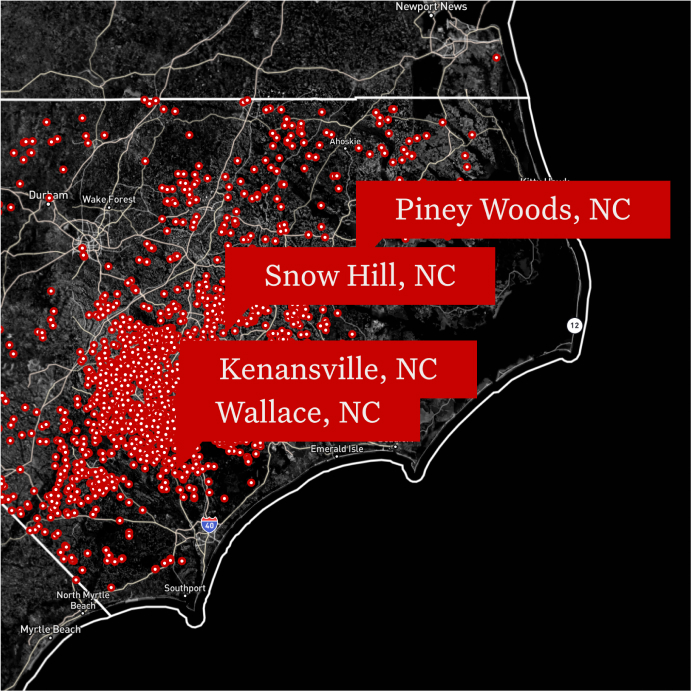
- Historical Redlining Maps: Overlayed on current satellite imagery, these maps vividly showed the long-term impacts of environmental policies on affected areas. For one story, we combined historical redlining maps and annotated areas impacted by a toxic waste dump, directly linking historical injustices to present-day challenges.
- Scroll-Powered Tour of the Skagit River: This interactive 3D map took users on a journey along the river, highlighting the locations of dams and their impact on traditional native fishing grounds. This immersive experience provided a visceral connection to the landscape and the environmental challenges faced by local communities.
One major challenge was the integration of complex data into user-friendly, interactive visualizations. We had to ensure that the data was not only accurate but also engaging and accessible to a diverse audience.
Another challenge we faced was maintaining the integrity and impact of the stories while translating them into visual formats. Our team worked closely with The Margin's editorial team to ensure that the visualizations were not only complementary but also enhanced the storytelling. This collaborative approach led to a seamless fusion of narrative and visual elements, with every piece enhancing the others.
The tight project timeline also pushed us to optimize our workflow, ensuring efficiency without compromising on creativity or quality. Our iterative design process, with rapid prototyping and constant feedback, allowed us to quickly adapt and refine our visualizations and provide multiple visualizations for each story.